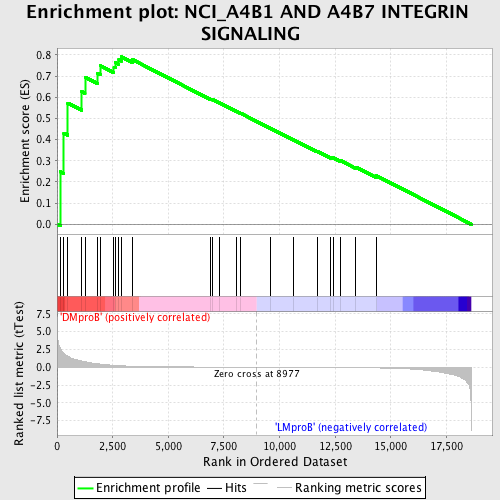
Profile of the Running ES Score & Positions of GeneSet Members on the Rank Ordered List
| Dataset | Set_04_DMproB_versus_LMproB.phenotype_DMproB_versus_LMproB.cls #DMproB_versus_LMproB |
| Phenotype | phenotype_DMproB_versus_LMproB.cls#DMproB_versus_LMproB |
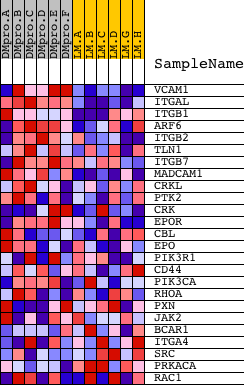
| Upregulated in class | DMproB |
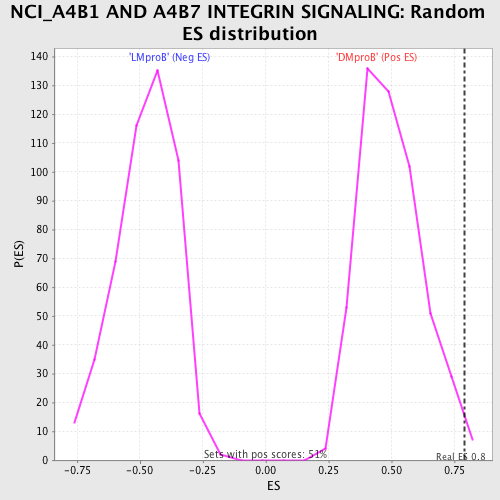
| GeneSet | NCI_A4B1 AND A4B7 INTEGRIN SIGNALING |
| Enrichment Score (ES) | 0.7904208 |
| Normalized Enrichment Score (NES) | 1.5854751 |
| Nominal p-value | 0.009803922 |
| FDR q-value | 0.18793617 |
| FWER p-Value | 0.888 |
| PROBE | DESCRIPTION (from dataset) | GENE SYMBOL | GENE_TITLE | RANK IN GENE LIST | RANK METRIC SCORE | RUNNING ES | CORE ENRICHMENT | |
|---|---|---|---|---|---|---|---|---|
| 1 | VCAM1 | 5851 | 148 | 2.595 | 0.2481 | Yes | ||
| 2 | ITGAL | 9187 | 304 | 1.928 | 0.4301 | Yes | ||
| 3 | ITGB1 | 3872 18411 | 482 | 1.537 | 0.5723 | Yes | ||
| 4 | ARF6 | 21252 | 1108 | 0.880 | 0.6255 | Yes | ||
| 5 | ITGB2 | 19978 | 1254 | 0.775 | 0.6942 | Yes | ||
| 6 | TLN1 | 15899 | 1827 | 0.487 | 0.7115 | Yes | ||
| 7 | ITGB7 | 22112 | 1937 | 0.441 | 0.7491 | Yes | ||
| 8 | MADCAM1 | 19966 | 2556 | 0.262 | 0.7418 | Yes | ||
| 9 | CRKL | 4560 | 2615 | 0.249 | 0.7632 | Yes | ||
| 10 | PTK2 | 22271 | 2777 | 0.217 | 0.7760 | Yes | ||
| 11 | CRK | 4559 1249 | 2880 | 0.202 | 0.7904 | Yes | ||
| 12 | EPOR | 19204 | 3380 | 0.143 | 0.7777 | No | ||
| 13 | CBL | 19154 | 6906 | 0.023 | 0.5904 | No | ||
| 14 | EPO | 8911 | 6977 | 0.022 | 0.5889 | No | ||
| 15 | PIK3R1 | 3170 | 7282 | 0.019 | 0.5744 | No | ||
| 16 | CD44 | 2881 2847 2893 4499 2724 | 8059 | 0.010 | 0.5336 | No | ||
| 17 | PIK3CA | 9562 | 8241 | 0.008 | 0.5246 | No | ||
| 18 | RHOA | 8624 4409 4410 | 9584 | -0.006 | 0.4530 | No | ||
| 19 | PXN | 5339 3573 | 10630 | -0.017 | 0.3985 | No | ||
| 20 | JAK2 | 23893 9197 3706 | 11684 | -0.030 | 0.3448 | No | ||
| 21 | BCAR1 | 18741 | 12304 | -0.039 | 0.3153 | No | ||
| 22 | ITGA4 | 4929 | 12412 | -0.040 | 0.3135 | No | ||
| 23 | SRC | 5507 | 12732 | -0.046 | 0.3008 | No | ||
| 24 | PRKACA | 18549 3844 | 13424 | -0.061 | 0.2697 | No | ||
| 25 | RAC1 | 16302 | 14356 | -0.096 | 0.2291 | No |